min117の日記

初期desireもち。趣味Mac,メインFedora,仕事xp。

python3 ビックテックGAFAMの株価を(引数の日付を1として)可視化する


GAFAM株価(起点日を1として)

こうなる。


今年の年初来だとこう(起点が2022/1/1)

2月にFacebook(現Meta)が30%近く株価下落したらしい。

www.bloomberg.co.jp


直近1か月だとこう。株価って起点をどこで見るかで全然印象が違う。


作ろうと思ったきっかけ

コレ。こういうグラフをコマンド一発で作りたいなと。

note.com


できた。実行。

$ python3 myKINRI26Arg.py 20190101

引数にとった日付(20190101)を起点にグラフを書いてpng画像で保存される。


リーマンショック前夜の2007年01月01日を起点にしてみよう。


Appleって(2007年当時からすると)株価が100倍くらいになってる…?

まだiPhone3Gも発売されてないときだから、そんなもんか。


ソース


ソース(コピペ用)

import pandas as pd
import pandas_datareader as web

import matplotlib.pyplot as plt
# %matplotlib inline
from matplotlib import rcParams
rcParams['figure.figsize']=15,10
rcParams['font.size']=15
import sys
import os
import numpy as np

import datetime

#if len(sys.argv) != 2 or ".pdf" not in sys.argv[1].lower():
if len(sys.argv) != 2:
        print(f"Usage: python {sys.argv[0]} 20220101(start date)")
        sys.exit()

print(f"引数: {sys.argv[1]}")
#print(sys.argv[1])

myARG1 = sys.argv[1]

# 20220101
# 01234567
myYEARR = myARG1[:4]
myMONTH = myARG1[4:6]
myDATEE = myARG1[6:]

#myDATE = myYEARR + '-' + myMONTH + '-' + myDATEE
myDATE = myYEARR + myMONTH + myDATEE

print(f"開始日:" + myDATE)

start=myDATE
enddd=datetime.date.today()
print(enddd)

fig = plt.figure()

print('GAFAM株価データ')

# ['Adj Close']で列指定しないと
# Open,Close,High,Low,AdjClose 全部出ちゃう
# df_GAFAM = web.DataReader(['AAPL', 'GOOG', 'MSFT'], 'yahoo', start, enddd)
#df_GAFAM = web.DataReader(['AAPL', 'GOOG', 'MSFT'], 'yahoo', start, enddd)['Adj Close']
#df_GAFAM = web.DataReader(['AAPL', 'GOOG', 'MSFT'], 'yahoo', start, enddd).dropna
#df_GAFAM = web.DataReader(['AAPL', 'GOOG', 'MSFT'], 'yahoo', start, enddd)
df_GAFAM = web.DataReader(['AAPL', 'GOOG', 'MSFT','META','AMZN'], 'yahoo', start, enddd)
#df_GAFAM = web.DataReader(['AAPL', 'GOOG', 'MSFT','META','AMZN', 'TSLA'], 'yahoo', start, enddd)

print('kj株価の推移はチェックできますが、そもそもの価格が違うので比較がしにくいです')
print('ので、open、開始価格を揃えて比較してみます。')
df_GAFAM['Adj Close', 'AAPL'] /= df_GAFAM['Adj Close'].loc[df_GAFAM.index[0], 'AAPL']
df_GAFAM['Adj Close', 'GOOG'] /= df_GAFAM['Adj Close'].loc[df_GAFAM.index[0], 'GOOG']
df_GAFAM['Adj Close', 'MSFT'] /= df_GAFAM['Adj Close'].loc[df_GAFAM.index[0], 'MSFT']
df_GAFAM['Adj Close', 'META'] /= df_GAFAM['Adj Close'].loc[df_GAFAM.index[0], 'META']
df_GAFAM['Adj Close', 'AMZN'] /= df_GAFAM['Adj Close'].loc[df_GAFAM.index[0], 'AMZN']
#df_GAFAM['Adj Close', 'TSLA'] /= df_GAFAM['Adj Close'].loc[df_GAFAM.index[0], 'TSLA']

###
# https://docs.pyq.jp/python/pydata/pandas/loc.html
###
#DataFrame.locを使うと行名、列名を利用してデータを取得できます。
#
# Attributes Adj Close                                ...      Volume
# Symbols         AAPL      GOOG      MSFT      META  ...        GOOG        MSFT        META        AMZN
# Date                                                ...
# 2021-12-31  1.000000  1.000000  1.000000  1.000000  ...  17298000.0  18000800.0  12870500.0  47830000.0
# 2022-01-03  1.025004  1.002730  0.995332  1.006511  ...  25214000.0  28865100.0  14537900.0  63520000.0

# 2022-01-04  1.011995  0.998182  0.978265  1.000535  ...  22928000.0  32674300.0  15998000.0  70726000.0
# 2022-01-05  0.985076  0.951437  0.940711  0.963788  ...  49642000.0  40054300.0  20564500.0  64302000.0
# 2022-01-06  0.968632  0.950729  0.933278  0.988435  ...  29050000.0  39646100.0  27962800.0  51958000.0
#
# [5 rows x 30 columns]
#

## #print('web.DataReader(data_source=\'yahoo\',name=\'^GAFAM\',start=yyyymmdd,end=yyyymmdd)[Adj Close]')
## #df_GAFAM = web.DataReader('^GAFAM', 'yahoo', start2, enddd2)
## df_GAFAM = web.DataReader(data_source='yahoo',
## #name='GAFAM',
## name=['AAPL', 'GOOG', 'MSFT'],
## #start=start).dropna()
## start=start)['Adj Close'].dropna()
## #start=start).dropna()['Adj Close']
## #start=start)['Adj Close']

## #end=enddd)['Adj Close']

#df_GAFAM.loc[:,'Adj Close'].plot()
###//  df_GAFAM['Adj Close'].plot()
# df_GAFAM['Adj Close'].plot(title='AAPL vs GOOG vs MSFT vs META vs AMZN', grid=True)
df_GAFAM['Adj Close'].plot(title=datetime.datetime.now(), grid=True)


# df_GAFAM.head()
print(df_GAFAM.head())
print('--------------------------')


ax1 = fig.add_subplot(1,1,1)
###ax1 = fig.add_subplot(2,1,1)
##ax1 = fig.add_subplot(3,1,2)
###ax1 = fig.add_subplot(2,1,1)
#ax1 = fig.add_subplot(3,1,1)
#ax1.plot(df_GAFAM,color='blue', lw=3)
ax1.plot(df_GAFAM,color='blue', lw=3, label="df_GAFAM")
#ax1.set_title('GAFAM'.join([str(datetime.datetime.now())]),fontsize=20)
#ax1.set_title(datetime.date.today(),fontsize=20)

plt.legend(bbox_to_anchor=(0, 1), loc='upper left', borderaxespad=1, fontsize=18)

plt.grid(True)
#plt.savefig("myKINRI26_df_GAFAM.png")
plt.savefig("/media/hoge/fuga/myKINRI26_df_GAFAM.png")
print('myKINRI26_df_GAFAM.pngを保存しました')


print('--------------------------')
#print('https://qiita.com/innovation1005/items/5be026cf7e1d459e9562')
print('https://nanjamonja.net/archives/303')


その買うを、もっとハッピーに。|ハピタス

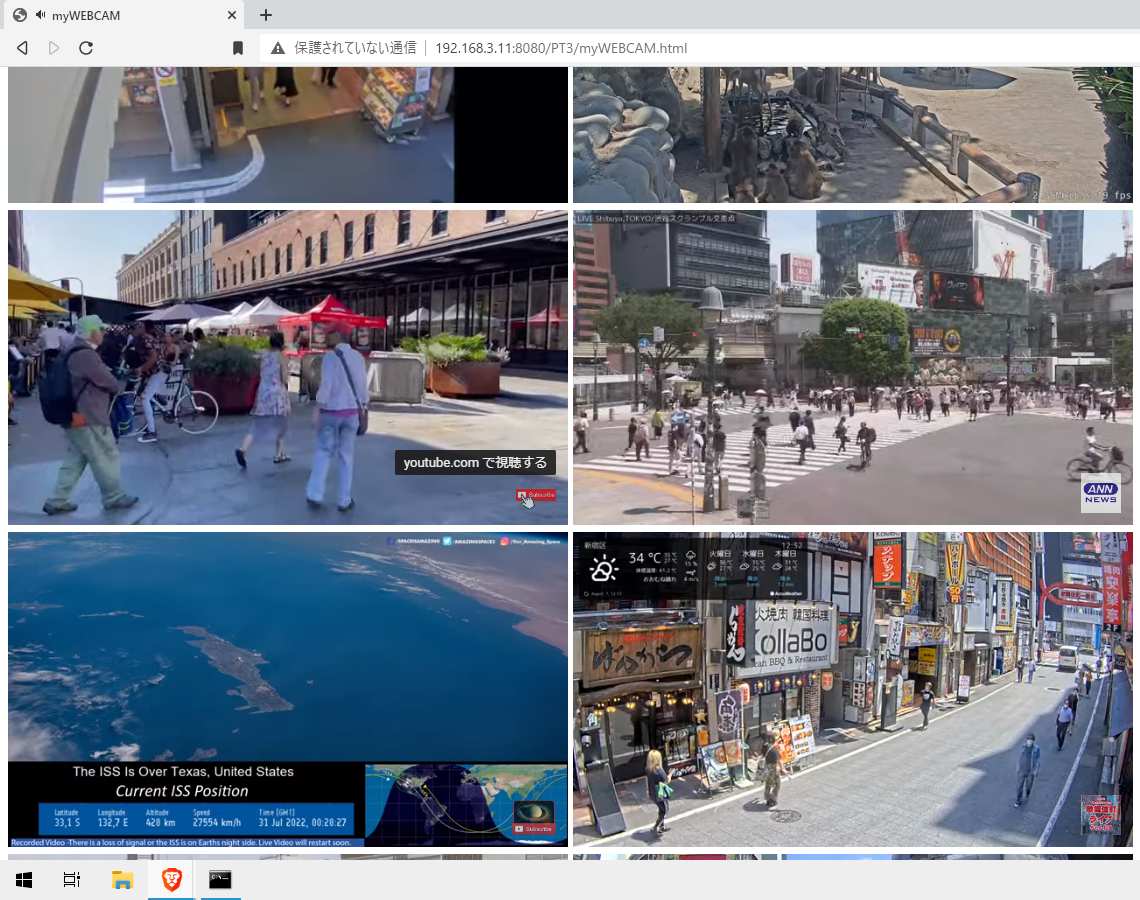
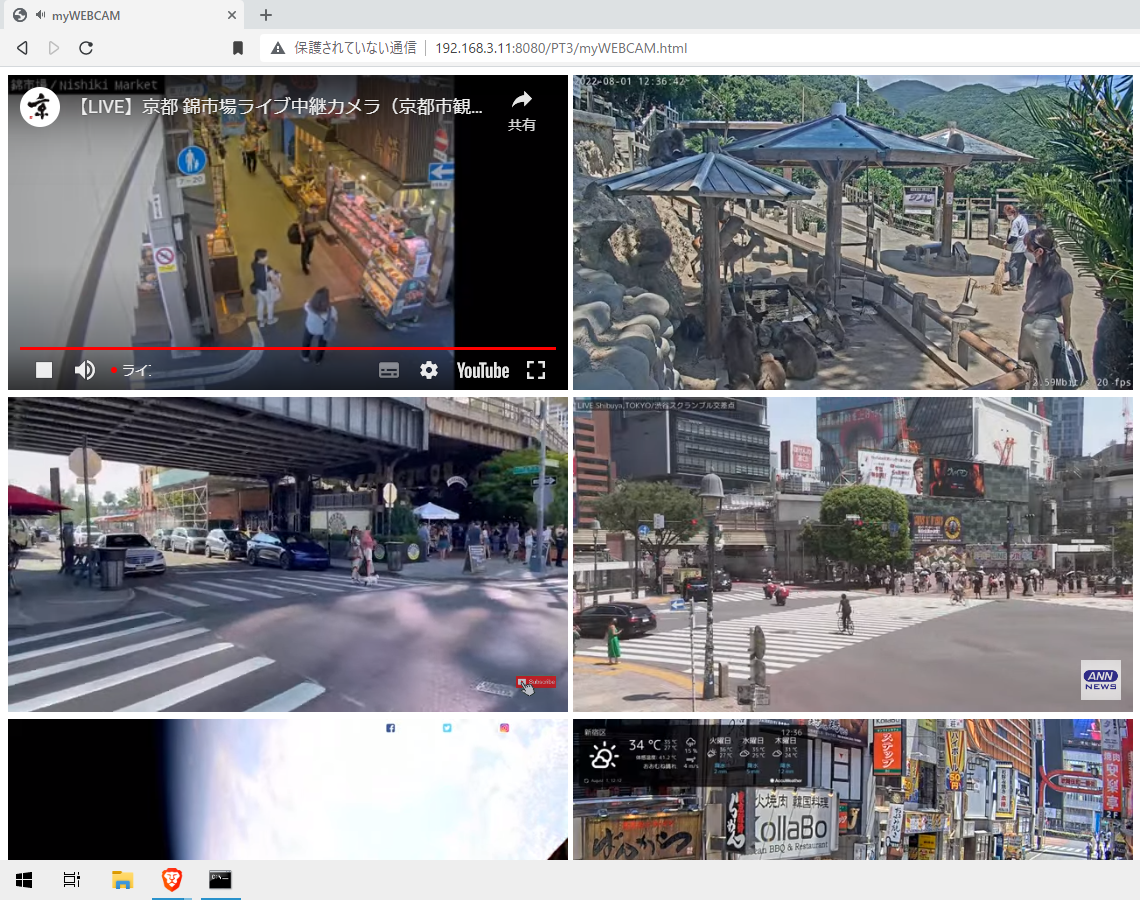
youtubeライブカメラ配信を1画面で同時に10個みる(シンプル自作html)

こんな感じ。


つべのembedリンクを並べただけ。

自宅サーバにhtmlおいて昼飯食いながら眺めてる。


シンプルだけど楽しめる。


見たいツベの「共有」から

「埋め込み」をクリックして

iframeリンクをコピッて

ソースに貼るだけ


やっぱ人がたくさん映ってるほうがおもしろい。動物は同種の他個体の動きに興味もつようにできてるってことか。


ソースhtml


その買うを、もっとハッピーに。|ハピタス

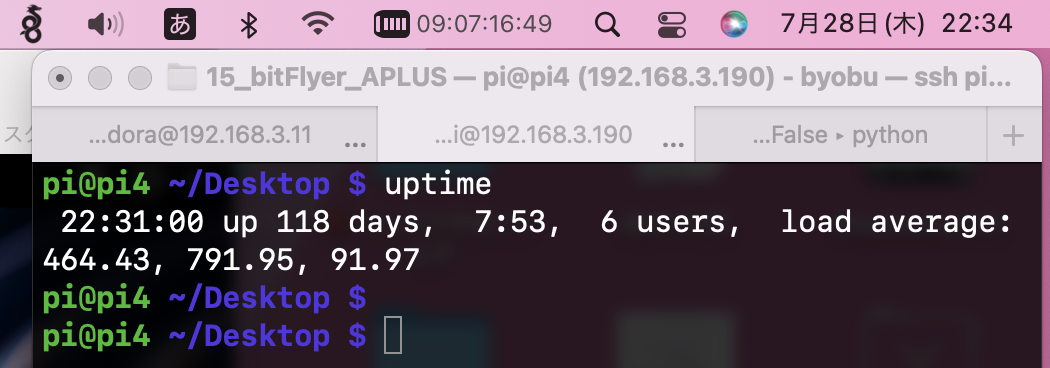
RaspberryPi4 にVPNサーバ(wireguard)導入して無停電・丸4ヶ月

ハピタス登録で1,000円分になるURL

その買うを、もっとハッピーに。|ハピタス


min117.hatenablog.com


ラズパイにWireGuardインストールして全国どこからでも宅内IPアドレス環境。


長期の東京出張に向けて導入したのが3月。

min117.hatenablog.com


118days 経過。

一度も不具合を起こさない。


消費電力も超少ない。

最高すぎ。


英語文字起こし 2022/6/15 FRBパウエル議長(金融政策発表)


FOMC Press Conference, June 15, 2022

Good Afternoon


I will begin with one overarching message.

We at the Fed understand the hardship that high inflation is causing.

We are strongly commited to bringing inflation back down, and we're moving expeditiously to do so.


expeditiously 迅速に


We have both the tools we need and the resolve that it takes to restore price stability on behalf of American families and buisinesses.

on behalf of 代表して


The economy and the country have been through a lot over the past two and a half years and have proved resilient.

It is essential that we bring inflation down if we are to have a sustained period of strong labor market conditions that benefit all.


sustain 保つ


From the standpoint of our congressional mandate to promote maxmum employment and price stability, I will begin with one overarching message.

mandate 委任


The current picture is plain to see.The labor market is extremely tight,and inflation is much too high.

Against this backdrop, today the Federal Open Market Committee raised its policy interest rate by percentage point and anticipates that ongoing increases in that rate will be appropriate.

policy interest rate 政策金利


In addition, we are continuing the process of significantly reducing the size of our balance sheet.

significantly 大幅な 

I'll have more to say about today's monetary pocily actions after briefly reviewing economic developments.

briefly ざっと、簡単に

ecnomic developments 経済動向

Overall economic activity edged down in the first quarter, as unusually sharp swings in inventories and net exports more than offset continued strong underlying demand.

inventories 在庫

net exports 純輸出

offset 相殺

第1四半期には、在庫と純輸出の異常な急激な変動が引き続き強い根底にある需要を相殺したため、全体的な経済活動は鈍化しました


Recent indicators suggest that real GDP growth has picked up this quarter, with consumption spending remaining strong.
Improvement in labor market conditions HAVE BEEN widespread, including for workers and at the lower end of the wate distribution as well as for African Americans and Hispanics.
FOMC participants expecT supply and demand conditions in the labor market to come INTO better balance, easing the upward pressureS on wages and prices.

The median projection IN the SEP for the unemployment late riseS somewhat over the next few years, moving from 3.7 percent at the end of this year to 4.1 percent in 2024, levelS that are noticeably abovee THE March projectionS.

projection 予測

失業後期のSEPの中央値予測は、今後数年間でやや上昇し、今年末の3.7%から2024年には4.1%に上昇し、3月の予測を大幅に上回っています

Inflation remains well above our longer-run goal of 2 percent.

Over the 12 monthS ending in April, total PCE priceS rose 6.3 percent, excluding the volatile fooD and energy categorieS, core priceS rose 4.9 percent.

In May, the 12-montH change in the comsumer pricE index came in above expectationS at 8.6 percent, and THE change in the core CPI was 6 percent.

Aggregate demand is strong, supply constraintS HAVE BEEN larger and longer lasting than anticipated, and price pressureS HAVE spread to A broad range of goodS and serviceS.

The surge in priceS of crude oil and other commoditieS that resultED from Russia's invasion of Ukraine IS BOOSTING prices FOR gasolinE and food, and IS CREATING additional upward pressure on inflation.

And COVID-related lockdownS in China are likely to exacerbate supply chain disruptions.

FOMC participationS have revised up their projectionS FOR inflation this year, particularly for total PCE inflation given developments in food and energy prices.

The median projection is 5.2 percent this year and fallS to 2.6 percent next year and 2.2 percent IN 2024.

ParticiPANTS continue to see riskS to inflation as weighted to the upside.

The Fed's monetary policy actions are guided by our mandate to promote maximum employmenT and stable priceS for American people.

My colleagueS and I ARE actualy aware that high inflation imposes significant hardship, especially ON those least able to meet the higher costS of essentialS like food, housing, and transportation.

We are highly attentive to the riskS high inflation poseS to both sides of our mandate, and we are strongly commmited to returning inflation to our 2 percent objective.

Against THE backdrop of rapidly envolving economic enviroment, our policy HAS BEEN adapting, and it will continue to do so.

(5:30)
At today's meeting, the Committee raised THE target range FOR the Fedral FundS rate by percentage point, resulting in A 1 and half percentage point increase in the target range so far this year.

The Committee reiterated that it anticipateS that ongoing increases in the target range will be appropriate.

And we are continuing the process of significantly reducing the size of our balance sheet which playS an important role in firming the stance of monetary policy.

Coming our of or last meeting in May, there was A broad sense ON the Committee that a half percentage point increasE in the target range should be considered at this meething if econoic and financial conditions evolved in line with expectations.

We also stated that we WERE highly attentive to inflation risks and that we WOULD BE nimble in responding TO incoing data and the evolving outlook.

Since then, inflation HAS agein SURPRICES to THE upsidE, some indicators of inflation expectations HAVE RISEN, and projectionS FOR inflation this year HAVE BEEN reviced up notably.


to be continued... (続く)

www.youtube.com


その買うを、もっとハッピーに。|ハピタス

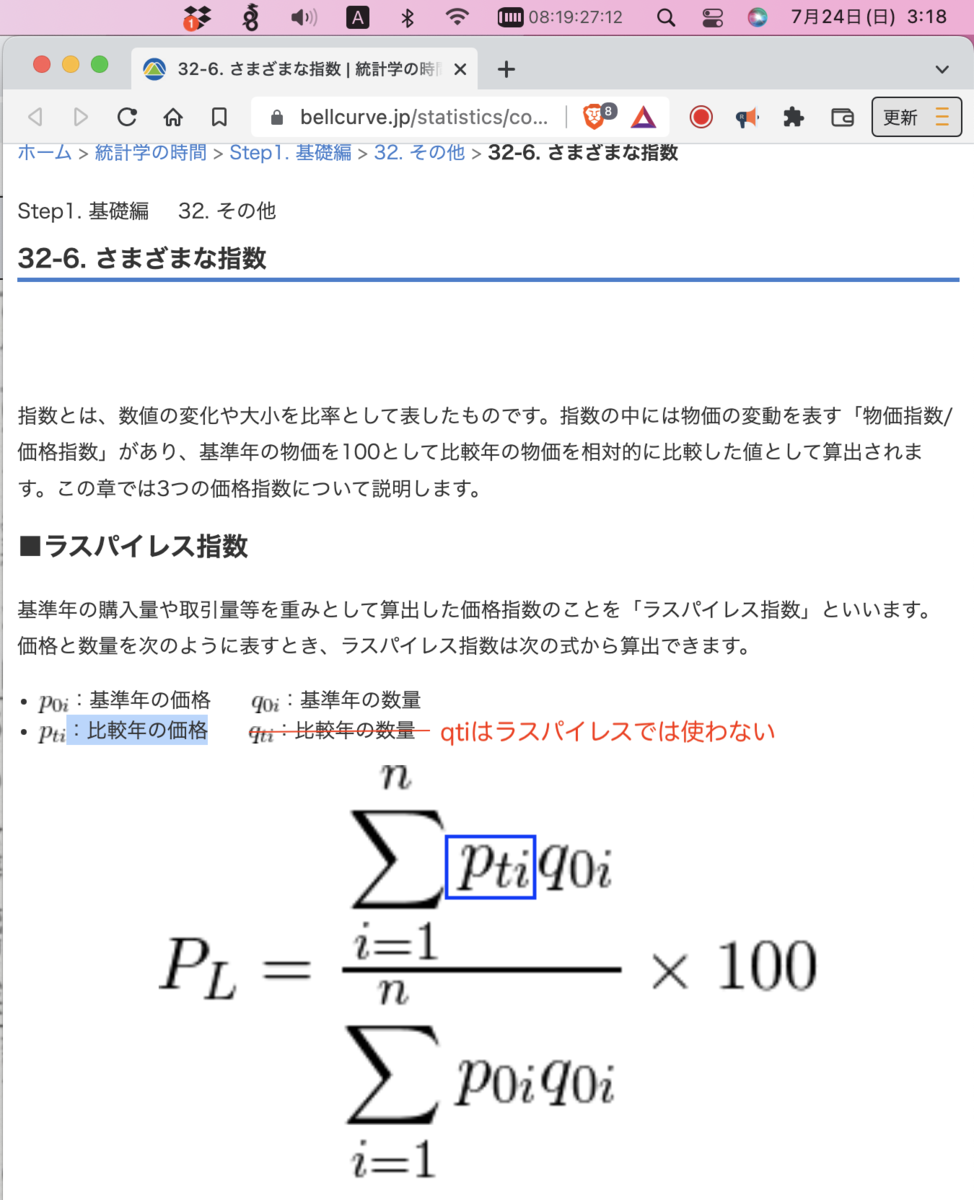
bash 消費者物価指数CPI(ラスパイレス指数)を計算

仮設例

比較年(2022年6月)現在

 価格 208円(税抜き)

 価格 224円(税込み)

 数量 4個(1週間に1個のペースで買ったとする)


基準年(2019年6月)過去

 価格189円(税抜き)

 価格 207円(税込み)

 数量 4個(同上)

CPIは110。物価は上がっている。


ラスパイレス指数(CPI消費者物価指数、企業物価指数)

 過去(基準年)に買った数と同じ数を今(比較年)で買ったら値段はどうか?


パーシェ指数GDPデフレータ計算)

 今(比較年)に買おうとしている数過去(基準年)時点で買ってたとして値段は上がったか下がったか?


熊本市の例

 基準年(過去)=2020年 を100として

 比較年(現在)=2022年 のCPIは 101.2

  少し遡って

 比較年(現在)=2021年 だとするとCPIは99.0(グラフより)

  なので前年同月比で

 101.2 - 99.0 = 2.1 上がっている

www.pref.kumamoto.jp


www2.kumagaku.ac.jp


bellcurve.jp


qiita.com


その買うを、もっとハッピーに。|ハピタス

米10年債利回りと5年債のグラフを重ねて表示する fig.add_subplot(行数, 列数, 表示する行)


これがやりたかった

… 米10年国債の利回り

ピンク… 米5年国債の利回り

3月くらいからピンクが青を上回ってる。これも逆イールドと言っていいのか。

www.youtube.com


グラフの start を 5月にしてみると

直近3ヶ月に拡大して見れる感じ(今日は7月18日)。


ソース

 fig.add_subplot(行数, 列数, 表示する行)  関数にクセがある。


$ vim myKINRI07.py

↑ 46行目 fig.add_subplot(2, 1, 1)

↓ 71行目 fig.add_subplot(2, 1, 1) が同じなのでグラフが重なる


実行

$ python3 myKINRI07.py


でけた。2年債あれば逆イールド撮れるのに…(yahooに無いの?)


cronに登録

$ sudo vim /etc/crontab

毎時12分に実行させとく(9時12分、10時12分…と24時間)と

自鯖のWebサイトから

いつでも見れるのじゃぜ。


あとで改良

・2年債も入れたい

・引数に日付とって開始(終了)を渡せるようにしたい。

・グラフを縦に4つ並べるか、2つのままだけど画像分けて保存させる。

・S&P500グラフも追加して株の動きとも合わせて見るようにする。


indepth-markets.com

finance.yahoo.co.jp

support.yahoo-net.jp


その買うを、もっとハッピーに。|ハピタス

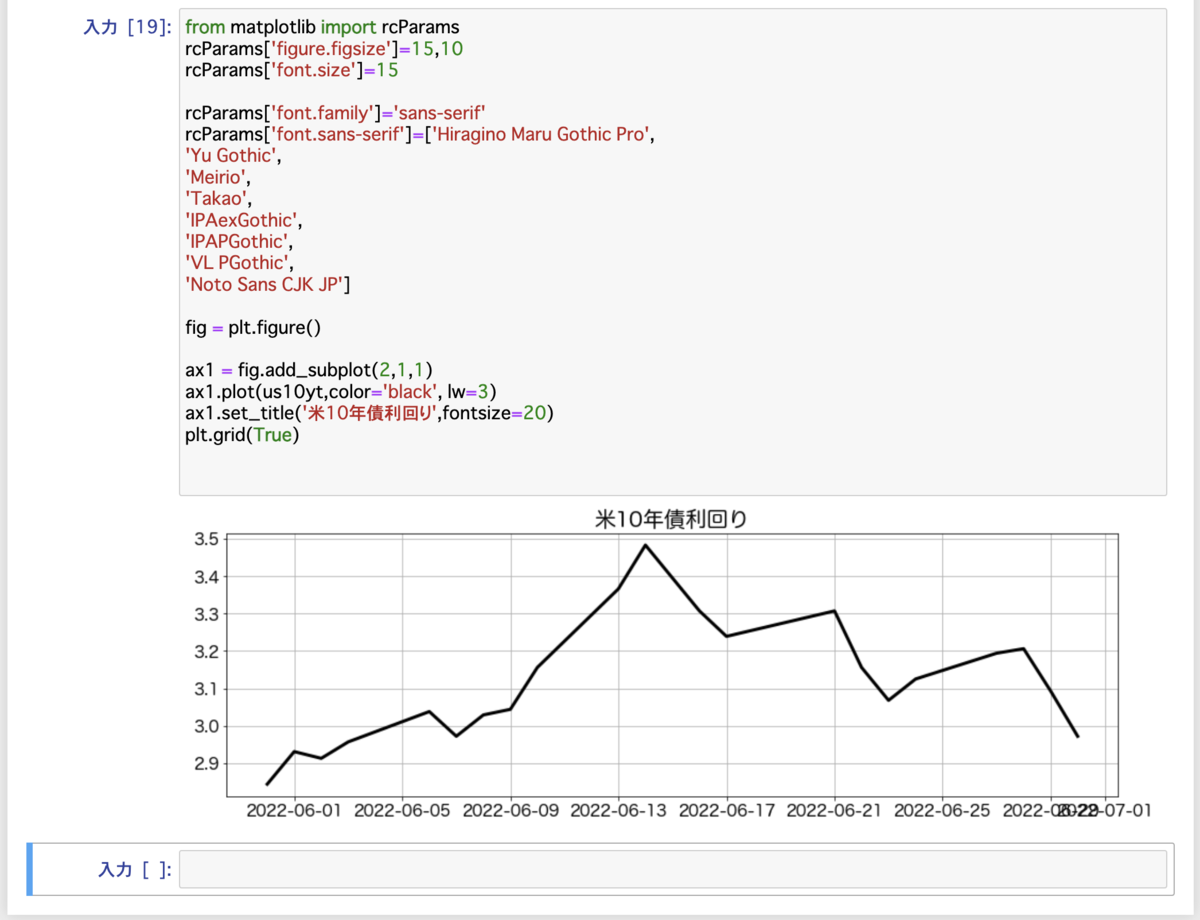
米10年債利回りとナスダックをグラフにする(Jupyter iPython)pip3 install pandas-datareader


金利、利回り、景気との関係、株価への影響…

いろいろ分かると楽しすぎる。


グラフにしてみる。

indepth-markets.com


グラフはJupiterが手っ取り早い。ひっさびさに起動。

alias 切ってあった。


!pip3 install pandas-datareader

インストールのときは pandas-datareader(ハイフン)

importするときは pandas_datareader(アンダーバー)


実行す。

おおー


ナスダック追加。

うむ。


fig.add_subplot(ここ) をいじくってみる

fig.add_subplot(2,1,1) グラフ合体。おかしくなった。


fig.add_subplot(2,2,1) にしてみよう。

横に二つ並ぶのね。


endを「今日」にしたいので

冒頭に import datetime を追加。

end=datetime.date.today() にする。

米10年国債利回りってこんな動いてるのね。

※ 明日2022/7/13(水)は7月の米CPI(消費者物価指数が出るはず。FRBはさらに利上げするのか?見もの。


Webにあるのと比較。


日経225


グラフ楽しい。いろいろ作って試す。


手出しゼロで利用できる♪話題のポイ活始めるならモッピー!


その買うを、もっとハッピーに。|ハピタス